Plot colour vectors and colour palettes as swatches.
Arguments
- x
An object of class
palettes_paletteorpalettes_colour.- n
An integer specifying the number of colours to return.
- direction
Sets the order of colours in the scale. If 1, the default, colours are ordered from first to last. If -1, the order of colours is reversed.
- space
The colour space to interpolate in. One of:
"cmy","hsl","hsb","hsv","lab"(CIE L*ab),"hunterlab"(Hunter Lab),"oklab","lch"(CIE Lch(ab) / polarLAB),"luv","rgb"(sRGB),"xyz","yxy"(CIE xyY),"hcl"(CIE Lch(uv) / polarLuv), or"oklch"(Polar form of oklab).- interpolate
The interpolation method. Either "linear" (default) or "spline".
- ...
Not used.
Value
A ggplot2 object. The output has the following properties:
For objects of class
palettes_colour: A plot of colour swatches.For objects of class
palettes_palettewith one palette: A plot of colour swatches with the palette name spanned across the swatches.For objects of class
palettes_palettewith more than one palette: A faceted plot of colour swatches with palette names as facet titles.
Examples
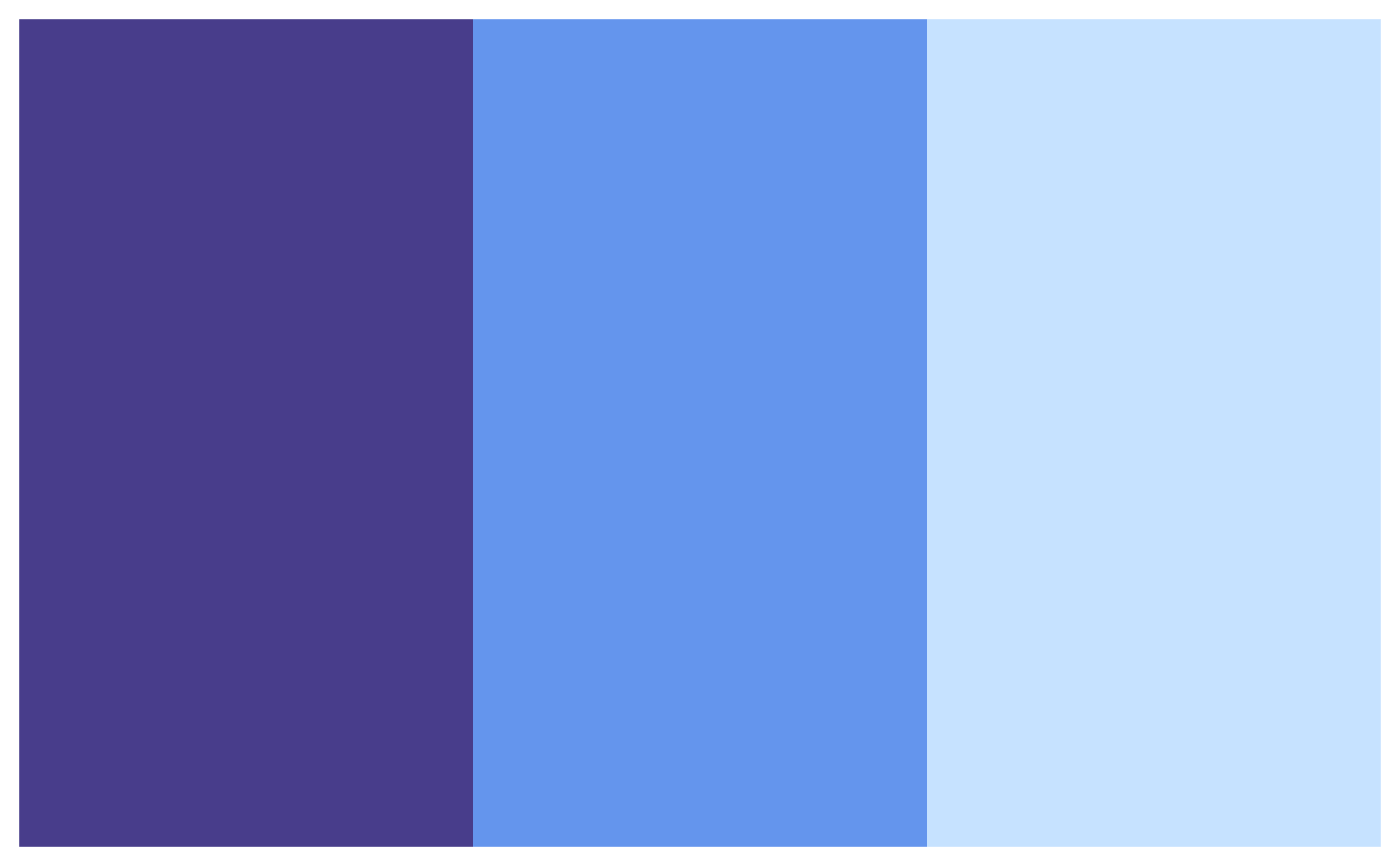
# Objects of class `palettes_colour` are plotted as swatches.
x <- pal_colour(c("darkslateblue", "cornflowerblue", "slategray1"))
plot(x)
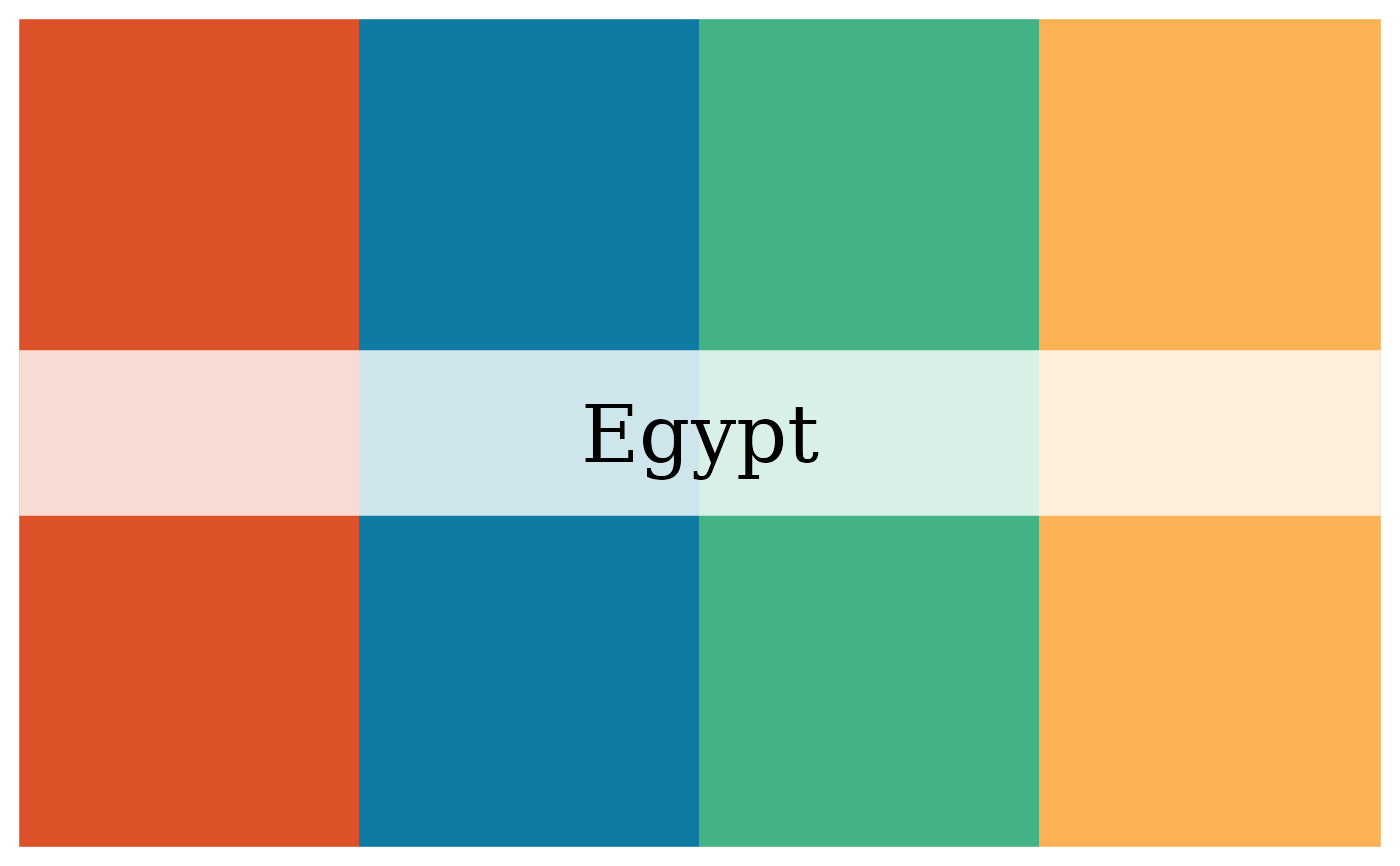
 # Objects of class `palettes_palette` with one palette are plotted with
# the palette name spanned across the swatches.
y <- pal_palette(Egypt = c("#DD5129", "#0F7BA2", "#43B284", "#FAB255"))
plot(y)
# Objects of class `palettes_palette` with one palette are plotted with
# the palette name spanned across the swatches.
y <- pal_palette(Egypt = c("#DD5129", "#0F7BA2", "#43B284", "#FAB255"))
plot(y)
 # Objects of class `palettes_palette` with multiple palettes are faceted.
z <- pal_palette(
Egypt = c("#DD5129", "#0F7BA2", "#43B284", "#FAB255"),
Java = c("#663171", "#CF3A36", "#EA7428", "#E2998A", "#0C7156")
)
plot(z)
# Objects of class `palettes_palette` with multiple palettes are faceted.
z <- pal_palette(
Egypt = c("#DD5129", "#0F7BA2", "#43B284", "#FAB255"),
Java = c("#663171", "#CF3A36", "#EA7428", "#E2998A", "#0C7156")
)
plot(z)
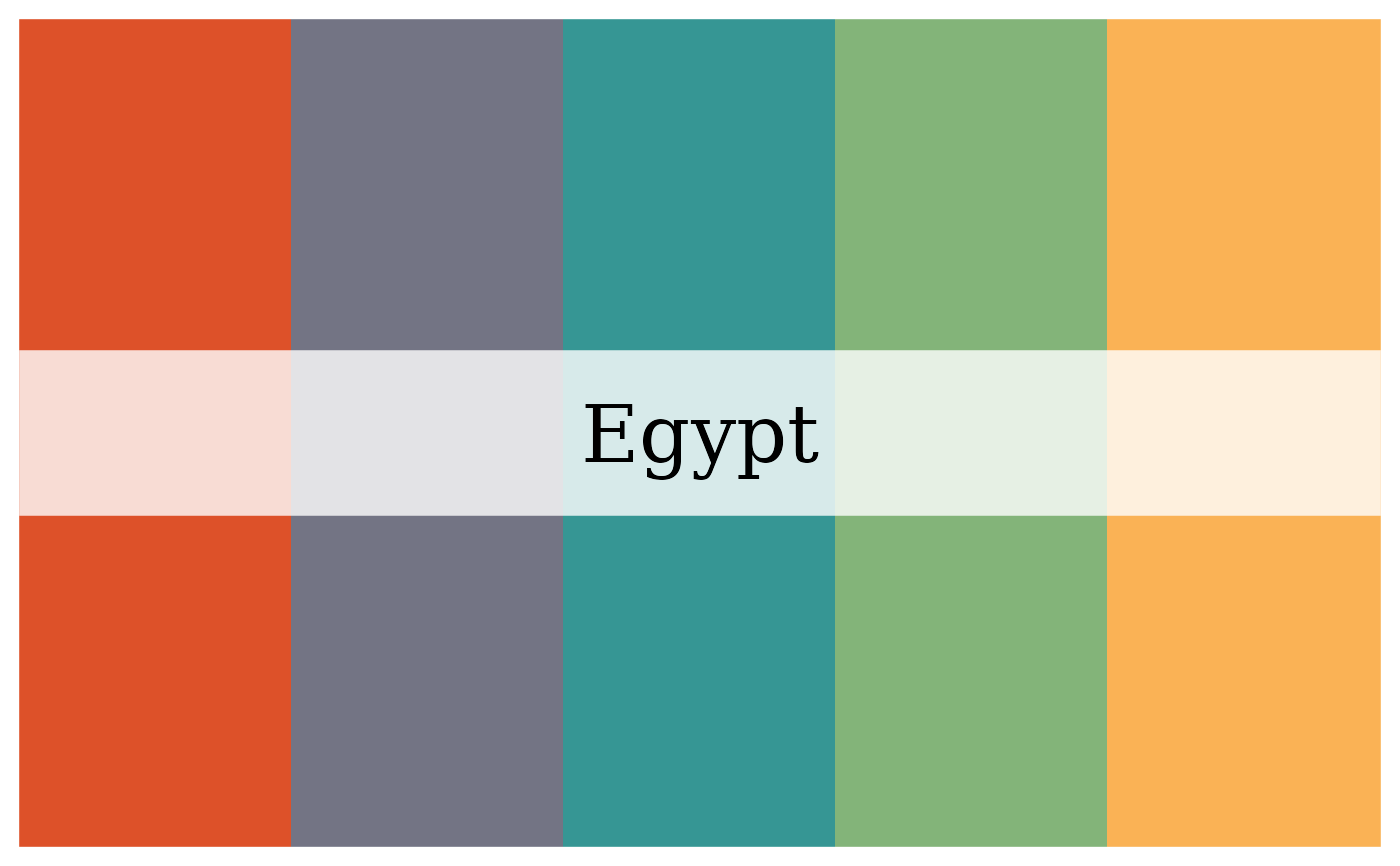
 # Colours can also be interpolated.
plot(x, n = 5)
# Colours can also be interpolated.
plot(x, n = 5)
 plot(y, n = 5)
 plot(z, n = 5)